Agent observability
See exactly what every agent did, with instance views, timelines and operations dashboards.
What it is
Agent observability gives you a clear view of what each agent actually did, from the detail of a single run through to fleet-wide operations dashboards. Flowable Inspect shows all agent executions of the current case or process instance during development, while dashboards in Flowable Work and Flowable Hub aggregate agent activity for the people running the platform.
What’s included:
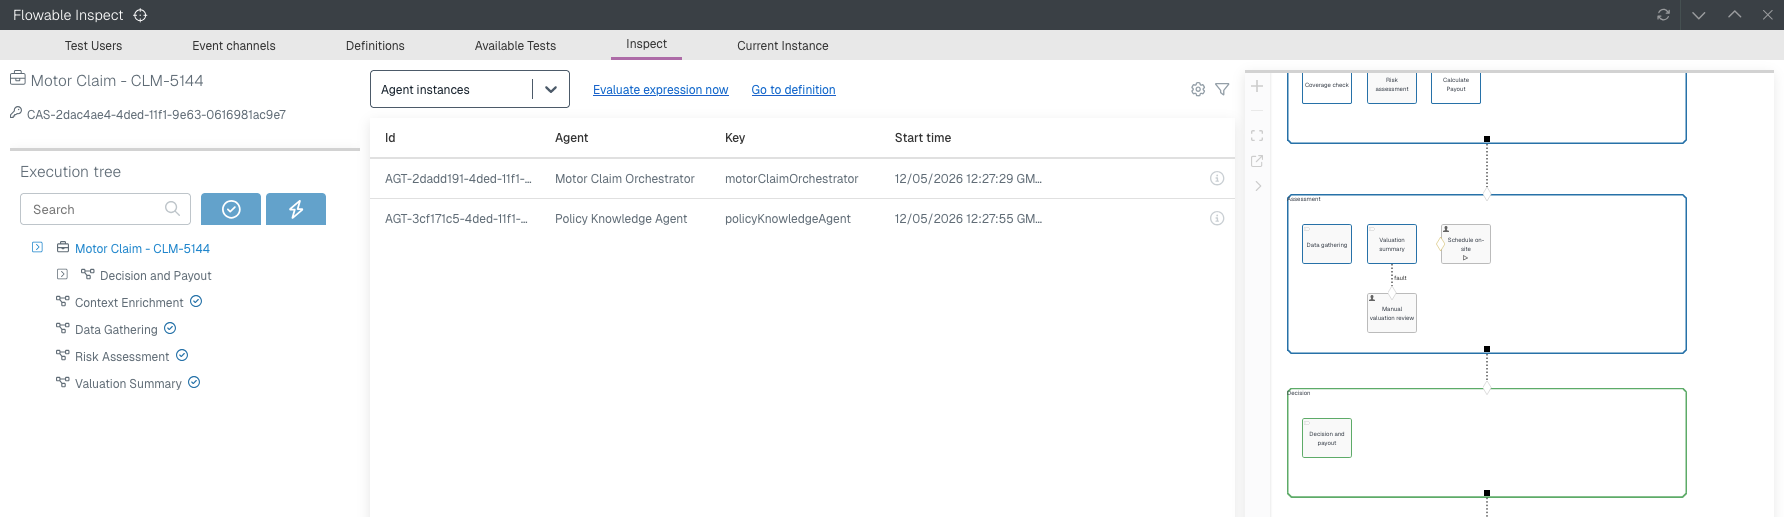
An agent instance view in Inspect within Flowable Work, to inspect the details and execution of individual AI agent instances.
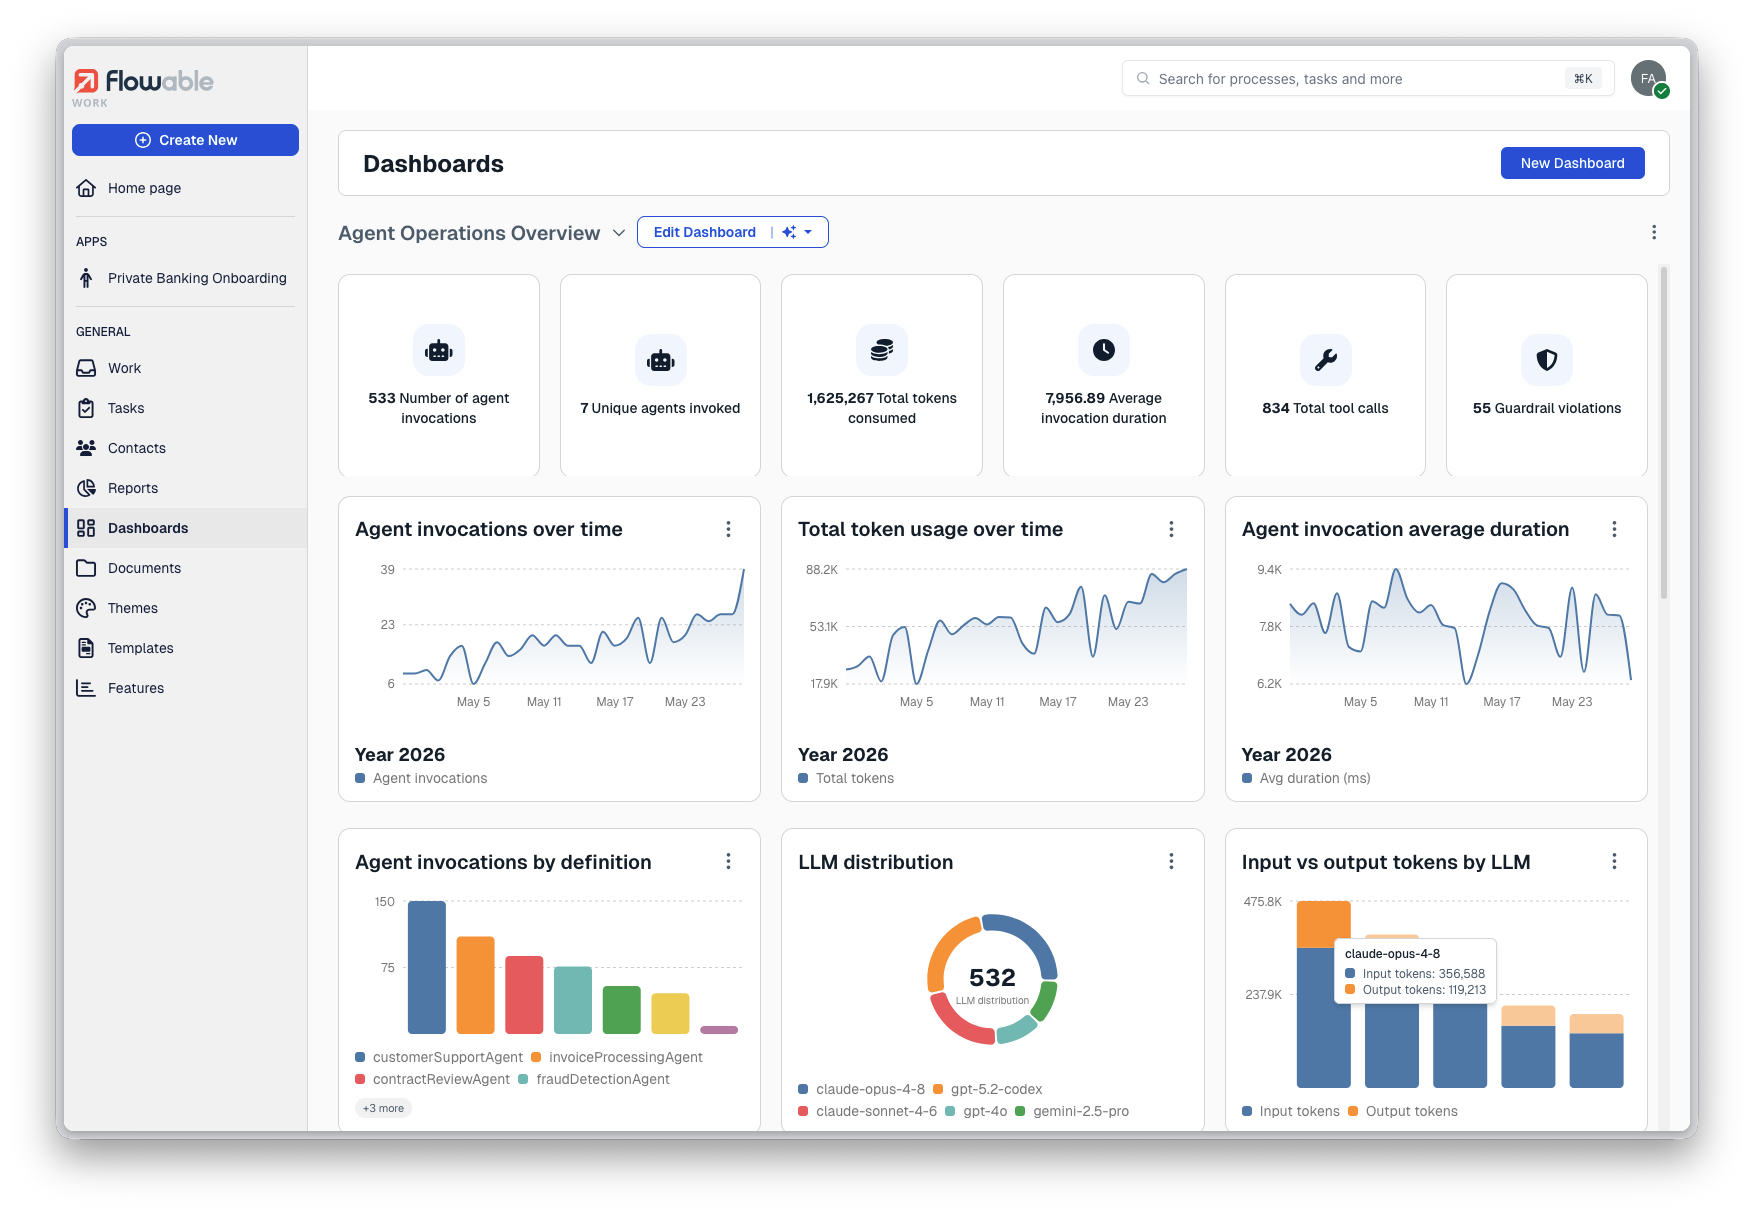
An improved Agent dashboard in Flowable Control/Hub
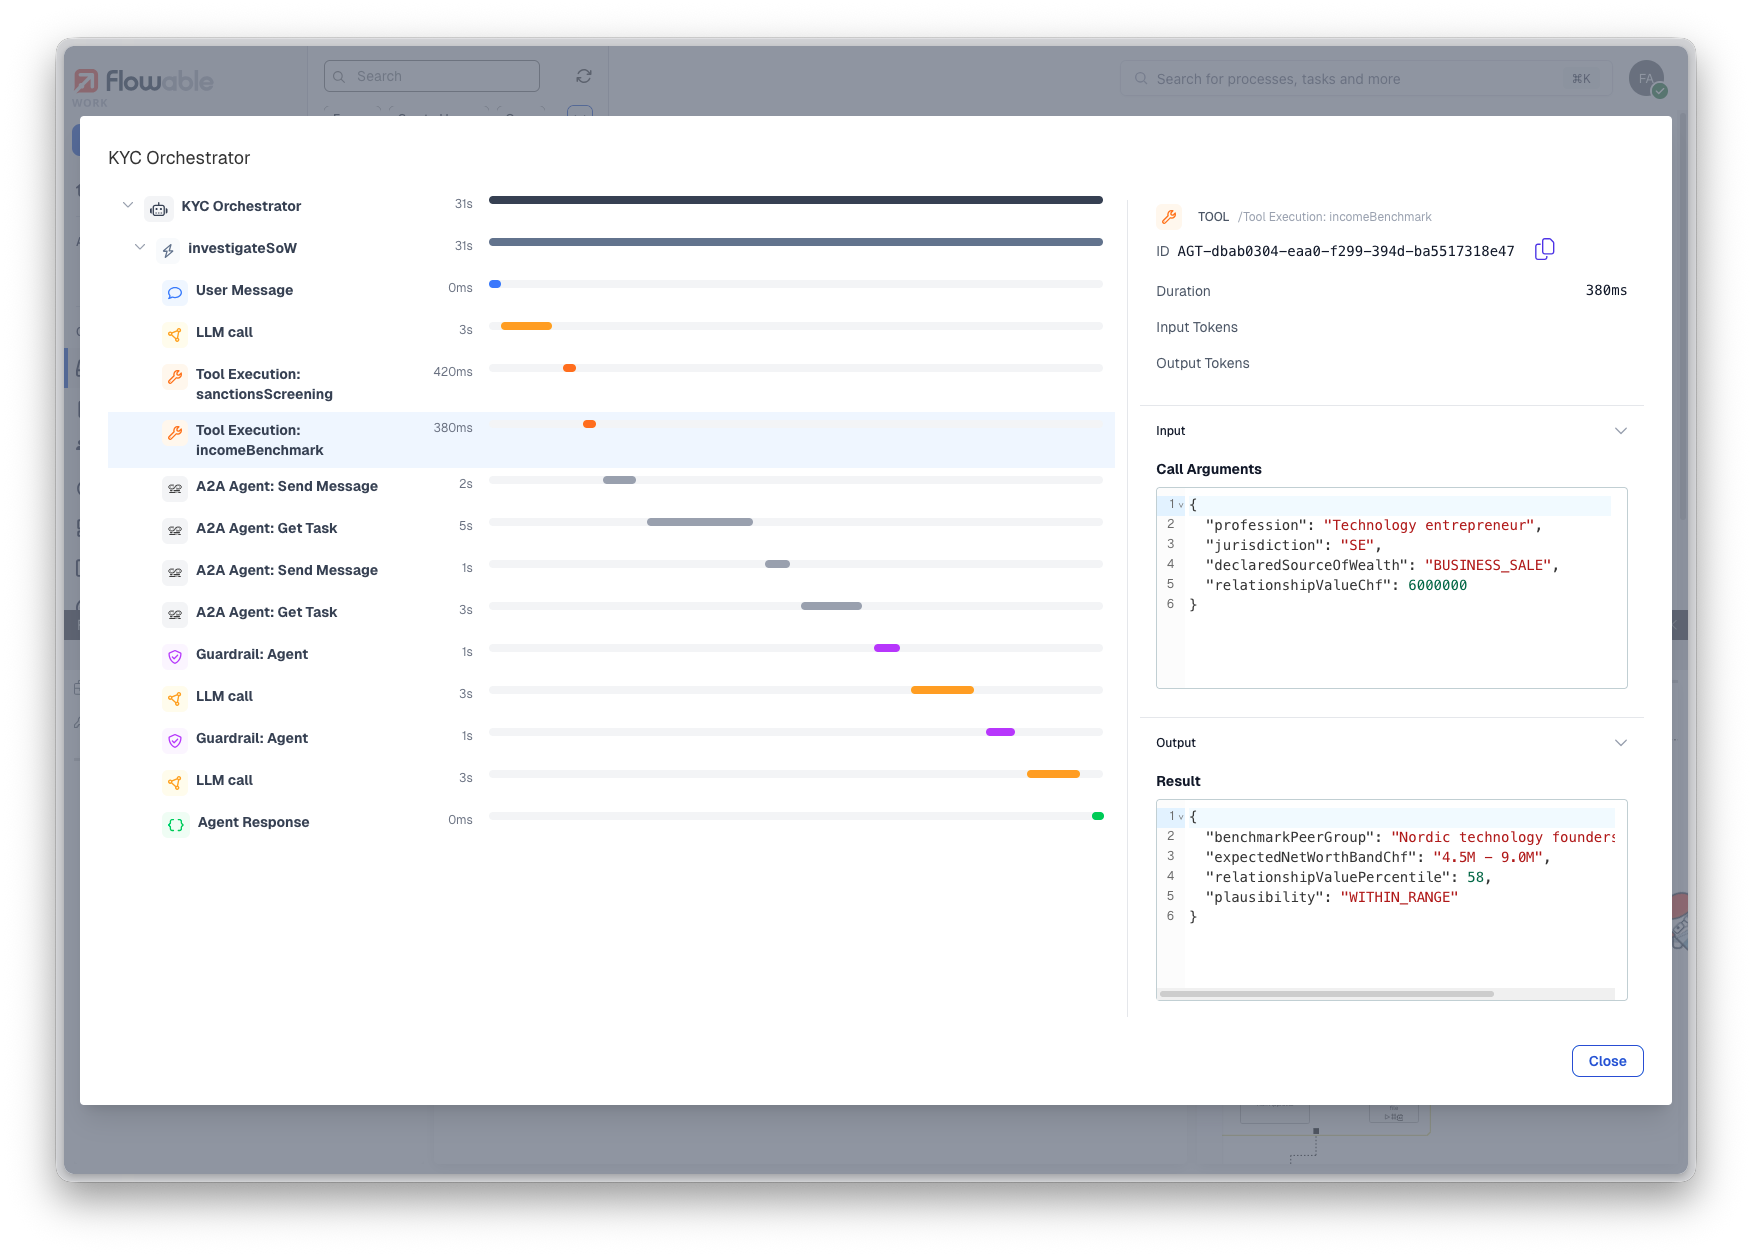
The agent timeline that was already introduced for Flowable Control in 2025.2 now also surfaces agent instances in Flowable Inspect and Flowable Hub, including all executions in the entire tree of subcases and subprocesses.
Why it matters
Putting agents into production means being able to answer what an agent did, when, and why, whether you are debugging one run or reporting on thousands. The instance view and timeline give a modeller or support engineer the trace they need to understand a single run, including the agent activity nested inside child processes and cases. The operations dashboards give platform owners the aggregate picture they need to monitor and govern agent activity across the estate.
How it works
When an agent runs during, its execution is recorded so Flowable Inspect can present the instance view and the agent details tab during development. The agent timeline shows the entire run with all tool, LLM and external agent calls, guardrails and pulls in agent instances that ran inside child process and case instances, so a nested run is not hidden. The operations dashboards in Flowable Control, Flowable Hub and Flowable Work aggregate that same agent execution data for monitoring at scale or inspection of an individual run.
Example
A modeller is building an app that uses agent tasks in Flowable Design. To verify their implementation, they start an instance in Flowable Work and to see all agent invocations they open up Inspect. In the timeline they can see every LLM call with the system prompt and user prompt, including the output and any guardrails that were checked before or after the execution.
An auditor needs to see all LLM calls that were done in the context of one case. A support engineer opens the agent instance view in Flowable Hub and follows the timeline of the run, including the agent activity that happened inside a child process, to see exactly what the agent received and produced at each step. Separately, a platform owner watches the agent operations dashboard in Flowable Hub to track how agents are performing across all running work.